
Global sports industry stock market performers - Q1 2022
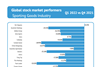
This exclusive interactive chart shows compares the stock performance of the top public companies in the sporting goods industry from Q4 2021 to Q1 2022. The chart can be downloaded. This is exclusive data and analysis for Premium Members.
This is Premium content
SIGN-IN if you are already a subscriber of SGI Europe

Become an SGI Europe Premium subscriber
Get access to what the top decision makers are reading in the sporting goods industry:
-
Unique international market and benchmarking data about sports brands and retailers
-
Exclusive Insights Reports included
-
Case Studies on best practices and success cases
-
Data visuals and infographics - downloadable charts, infographics and data
-
Organisation-wide access across offices, people and devices
View all subscription plans on our subscription page.

Intelligence, analysis and advice for the global sporting goods industry.
- COPYRIGHT © EDM PUBLICATIONS GMBH
- Contact us
- FAQS
- Terms and Conditions
- Privacy & Cookies Policy
- Impressum
- Issues
- Topics A-Z