
Infographic - SGI’s Sporting Goods Index vs MSCI Index - 2021 Update
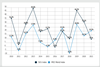
This exclusive chart shows the development of the top 88 stock listed sporting goods companies in comparison with the MSCI Index over the past 11 years (2010 to 2021).
SIGN-IN if you are already a subscriber of SGI Europe

Become an SGI Europe Professional subscriber
Get access to what the top decision makers are reading in the sporting goods industry:
- Access to all SGI Europe news across 14 coverage areas (Retail, Corporate & M&A, Financial, Product, Marketing, Trade & Sourcing, Sustainability, Technology,…)
- Access exclusive content before it breaks to the public, scoops and breaking news
- Essential E-mail Briefings with the latest analysis and most important industry developments of the international market
- C-Suite Interviews, guest chronicles from industry experts and leaders that are shaping the future of the industry
- Organisation-wide access across offices, people and devices

Intelligence, analysis and advice for the global sporting goods industry.
- COPYRIGHT © EDM PUBLICATIONS GMBH
- Contact us
- FAQS
- Terms and Conditions
- Privacy & Cookies Policy
- Impressum
- Issues
- Topics A-Z