

DTC and Retail infographics
-
 Infographics & Data
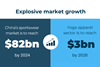
The growth trajectory of China’s athleisure market
China’s athleisure market forecast: Projected to reach $82.8 billion by 2024, highlighting key growth drivers and consumer trends.
-
 Infographics & Data
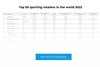
Top 50 sporting retailers in the world 2022
Download our annual overview of the world’s 50 largest sports retailers, including revenue and growth ranking compared with last year.
-
 Infographics & Data
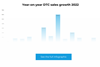
Year-on-year DTC sales growth 2022
How do the 2022 DTC sales at some of the biggest sporting goods companies compare with 2020 and 2021? We have the numbers for Nike, Adidas and more.
-
 Infographics & Data
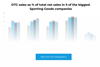
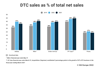
% of DTC sales at 5 of the biggest sporting goods companies
We bring you an updated infographic showing DTC sales as a percentage of total net sales at five of the biggest Sporting Goods companies, 2019-2022.
-
 Infographics & Data
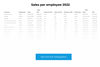
Sales per employee 2022 at sporting goods companies
Our downloadable infographic has employee numbers and sales per employee at 25 of some of the world’s biggest sporting goods companies.
-
 Infographics & Data
Canada Goose’s DTC growth plan
Canada Goose’s 5-year goals announced in February aim to increase DTC penetration. We look at a breakdown of the luxury brand’s own figures.
-
 Infographics & Data
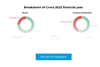
Crocs 2022 financial year revenue in detail
See how Crocs’ revenue for 2022 breaks down in our latest graphic.
-
 Infographics & Data
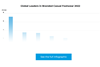
Global leaders in branded casual footwear 2022
Found out who were the leading casual footwear brands in 2022 in our latest graphic.
-
 Infographics & Data
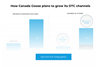
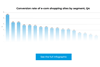
Conversion rate of e-com shopping sites by segment, Q4
See the conversion rates of various e-com segments in Q4, including four sporting apparel and footwear categories, in our graphic.
-
 Infographics & Data
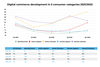
Digital commerce development in 5 consumer categories 2021/2022
See the changes in digital commerce revenue of the last 12 months in sporting goods, footwear, apparel and more in our graphic.
-
 Infographics & Data
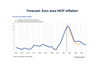
Forecasted HICP inflation in the Euro area
This chart shows the forecasted inflation rates for 2023 and 2024 in the Euro Zone from Eurosystem (the central banking system of the EU)
-
 Infographics & Data
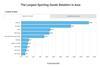
The largest sporting goods retailers in Asia
Our exclusive annual analysis of the largest sporting goods retailers in Asia. Charts and data are downloadable. Exclusive for Premium Members.
-
 Infographics & Data
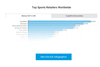
The Largest Sports Retailers Worldwide
Our exclusive annual analysis on the top 50 sports retailers worldwide. The charts and data can be downloaded. This is exclusive data and analysis for Premium Members.
-
 Infographics & Data
DTC’s share in VF’s revenue
This infographic shows the rise in DTC Digital as a percentage of VF Corp.’s revenue.
-
 Infographics & Data
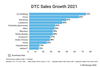
DTC Sales Growth 2021
This exclusive interactive chart shows the DTC sales growth of the major players in the sporting goods industry.
-
 Infographics & Data
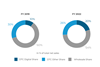
DTC sales of five major sports brands
This exclusive interactive chart shows the DTC sales of Adidas, Nike, Under Armour, VF Corp. and Puma as a percentage of total net sales for the financial years 2019, 2020 and 2021. The chart can be downloaded. This is exclusive data and analysis for Premium Members.
-
 Infographics & Data
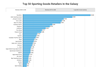
Top sporting goods retailers in Asia
This exclusive interactive chart ranks the top sporting goods retailers in Asia by revenues in USD for 2020 and percentage growth in their local currency. The charts and data can be downloaded. This is exclusive data and analysis for Premium Members.
-
 Infographics & Data
Top sporting goods retailers in Europe
This exclusive interactive chart ranks the top sporting goods retailers in Europe by revenues in USD for 2020 and percentage growth in their local currency. The charts and data can be downloaded. This is exclusive data and analysis for Premium Members.
-
 Infographics & Data
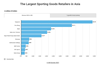
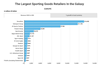
Top 50 Sporting Goods Retailers in the Galaxy
This exclusive interactive chart ranks the top 50 sporting goods retailers by revenues in USD for 2020 and percentage growth in their local currency. The charts and data can be downloaded. This is exclusive data and analysis for Premium Members.
-
 Infographics & Data
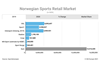
The Norwegian Sports Retail Market
This interactive chart shows the largest norwegian sports retailers by revenue in NOK (2019 and 2020) as well as the total market size 2019, 2020 including market shares. This chart can be downloaded as JPG, PNG or PDF.

