

DTC and Retail infographics – Page 2
-
 Infographics & Data
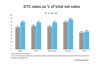
DTC sales of five major sports brands for 2019, 2020
This exclusive interactive chart shows the DTC sales of Adidas, Nike, Under Armour, VF Corp. and Puma as a percentage of total net sales for the financial years 2019 and 2020. The chart can be downloaded. This is exclusive data and analysis for Premium Members.
-
 Infographics & Data
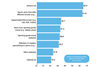
Amazon the major channel for german sporting goods consumers
Amazon is the major purchasing channel for german sporting goods consumers. This is an extract of the research study ”The sports brands winning the online race in Germany” in which we analysed 60 leading sports brands in Germany and conducted a survey with 3.000 consumers in Germany.
-
 Infographics & Data
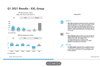
Q1 2021 Results XXL Group
This earnings briefing includes the highlights of the Q1 2021 for XXL Group
-
 Infographics & Data
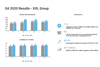
Earnings - Q4 2020 Results XXL Group
This earnings briefing includes the highlights of the Q4 2020 Interim Report of XXL Group
-
 Infographics & Data
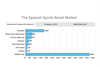
The Spanish Sports Retail Market
This interactive chart shows the largest spanish sports retailers by revenue, total market size 2019, market shares and revenue development vs the previous year. This chart can be downloaded as JPG, PNG or PDF.
-
 Infographics & Data
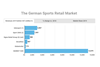
The German Sports Retail Market
This interactive chart shows the largest german sports retailers by revenue, total market size 2019, market shares and revenue development vs the previous year. This chart can be downloaded as JPG, PNG or PDF.
-
 Infographics & Data
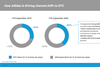
How Adidas is driving channel shift to DTC
This chart shows the DTC-share of total net revenues in Q3 2020 vs Q3 2019. This chart can be downloaded as JPG, PNG or PDF.
-
 Infographics & Data
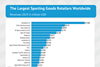
Ranking - The Largest Sporting Goods Retailers Worldwide
This exclusive chart shows the revenue development of the major global sporting goods retailers in 2019 vs 2018. The chart and data can be downloaded. This is exclusive data and analysis for Premium Members.
-
 Infographics & Data
Infographic - The Top 3 Sporting Goods Retailers in Norway
This exclusive chart shows the market share development of the top 3 sporting goods retailers in Norway over the past 10 years (2009 to 2018). This is exclusive data and analysis for Premium Members.
- Previous Page
- Page1
- Page2
- Next Page

