

Sporting goods market indices and indicators
-
 Infographics & Data
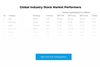
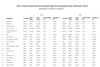
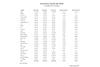
Full list: Global sporting goods industry stock market performers
How did the sporting goods industry do in 2023? Download our list of the 86 stock-listed sporting goods companies and their results from last year.
-
 Infographics & Data
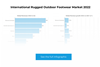
Outdoor footwear market 2022
2022 outdoor footwear sales are up. 5 companies represented just over 50% of all sales. We have all the growth, market share and sales numbers.
-
 Infographics & Data
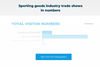
Sporting goods industry trade shows in numbers
With ISPO Munich just weeks away, we take a look at the numbers behind some of the sporting goods industry’s key trade shows.
-
 Infographics & Data
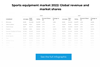
Sports equipment market 2022: Global revenue and market shares
Our infographic has the 2022 market sales and revenue numbers for 39 big names in Sporting Equipment for those who need the numbers fast.
-
 Infographics & Data
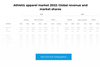
Sports apparel market 2022: Global revenue and market shares
Short on time, but want a summary of the global sports apparel market sales and revenue in 2022? Our infographic has the numbers for 29 big names.
-
 Infographics & Data
Athletic footwear market 2022: Global revenue and market shares
Short on time, but want a summary of the global athletic footwear market sales and revenue in 2022? Our infographic has the numbers for 25 big names.
-
 Infographics & Data
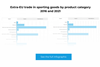
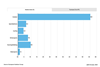
Extra-EU trade in sporting goods by product category
We look at the value of sporting goods exports and imports outside of the EU by category, as well as some insights into the numbers by nation.
-
 Infographics & Data
Becoming a super-winner in the sporting goods industry: The numbers from McKinsey
Some of the key numbers and strategies from McKinsey’s webinar “Becoming a super winner in the sporting goods industry,” available now only at SGI Europe.
-
 Infographics & Data
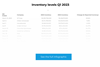
Sporting goods industry inventory levels Q1 2023
The Q1 numbers are in, and we focus on inventory. Download our infographic of inventory levels at 18 of the biggest Sporting Goods Industry companies.
-
 Infographics & Data
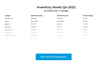
Sporting goods company inventory levels in Q4 2022
We’ve compiled inventory levels at the top sporting goods companies in Q4 2022. Found out how they compare with 2021 and across the industry
-
 Infographics & Data
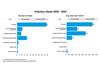
European 2022 retail sell-out sales across outdoor segments
We bring you a breakdown of retail sell-out sales across six outdoor segments in 2022 across six European countries
-
 Infographics & Data
Sporting goods deals 2016-2021
What was the average deal size and which category had the most deals 2016-2021? Find out in our latest interactive graphic.
-
 Infographics & Data
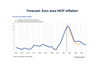
Forecasted HICP inflation in the Euro area
This chart shows the forecasted inflation rates for 2023 and 2024 in the Euro Zone from Eurosystem (the central banking system of the EU)
-
 Infographics & Data
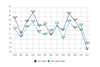
SGI’s Sporting Goods Index vs MSCI Index – 2022 Update
This exclusive chart shows the development of the top 87 stock-listed sporting goods companies compared to the MSCI Index over the past 12 years (2010 to 2022).
-
 Infographics & Data
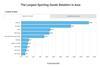
The largest sporting goods retailers in Asia
Our exclusive annual analysis of the largest sporting goods retailers in Asia. Charts and data are downloadable. Exclusive for Premium Members.
-
 Infographics & Data
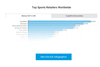
The Largest Sports Retailers Worldwide
Our exclusive annual analysis on the top 50 sports retailers worldwide. The charts and data can be downloaded. This is exclusive data and analysis for Premium Members.
-
 Infographics & Data
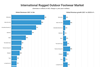
The international outdoor footwear market 2021
This exclusive, yearly analysis includes the market size as well as revenues, market shares and growth for the leading outdoor footwear brands for 2021 and 2020.
-
 Infographics & Data
Sports Equipment Market 2021
This exclusive, yearly statistic includes revenue and market share development of the major global sports equipment brands.
-
 Infographics & Data
Sporting goods company inventory levels in Q2 2022
This exclusive interactive chart shows inventory levels at 28 sporting goods companies for Q2 2022, comparing with Q2 2021 and Q4 2021. The chart can be downloaded. This is exclusive data and analysis for Premium Members.
-
 Infographics & Data
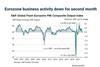
Eurozone business activity down for second month
The seasonally adjusted S&P Global Eurozone PMI® Composite Output Index dropped to 49.2 in August, from 49.9 in July signalling a second successive reduction in business activity across the eurozone following a 16-month period of growth.

