

All Data Visuals articles – Page 3
-
 Infographics & Data
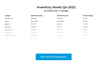
Sporting goods company inventory levels in Q4 2022
We’ve compiled inventory levels at the top sporting goods companies in Q4 2022. Found out how they compare with 2021 and across the industry
-
 Infographics & Data
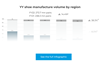
Yue Yuen’s 2022 shoe manufacture volume by region
We bring you a breakdown of Yue Yuen’s shoe manufacture volume by region
-
 Infographics & Data
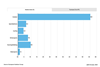
European 2022 retail sell-out sales across outdoor segments
We bring you a breakdown of retail sell-out sales across six outdoor segments in 2022 across six European countries
-
 Infographics & Data
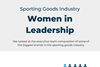
Gender and leadership in the sporting goods industry
How many women are on the executive teams and boards in the sporting goods industry? Find out in our latest exclusive interactive graphic.
-
 Infographics & Data
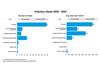
Sporting goods deals 2016-2021
What was the average deal size and which category had the most deals 2016-2021? Find out in our latest interactive graphic.
-
 Infographics & Data
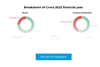
Crocs 2022 financial year revenue in detail
See how Crocs’ revenue for 2022 breaks down in our latest graphic.
-
 Infographics & Data
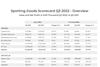
Analysis: Sporting Goods Scorecard - Q3 2022
Our Q3 Scorecard includes the revenue and profit development of 41 major sporting goods companies - benchmark yourself with the top players in the industry
-
 Infographics & Data
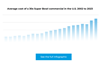
Average cost of a 30 second Super Bowl commercial in the U.S. 2002 to 2023
Found out how dramatically the cost of advertising at the Super Bowl has increased in our latest graphic.
-
 Infographics & Data
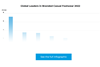
Global leaders in branded casual footwear 2022
Found out who were the leading casual footwear brands in 2022 in our latest graphic.
-
 Infographics & Data
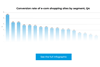
Conversion rate of e-com shopping sites by segment, Q4
See the conversion rates of various e-com segments in Q4, including four sporting apparel and footwear categories, in our graphic.
-
 Infographics & Data
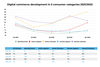
Digital commerce development in 5 consumer categories 2021/2022
See the changes in digital commerce revenue of the last 12 months in sporting goods, footwear, apparel and more in our graphic.
-
 Infographics & Data
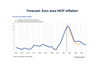
Forecasted HICP inflation in the Euro area
This chart shows the forecasted inflation rates for 2023 and 2024 in the Euro Zone from Eurosystem (the central banking system of the EU)
-
 Infographics & Data
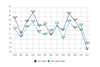
SGI’s Sporting Goods Index vs MSCI Index – 2022 Update
This exclusive chart shows the development of the top 87 stock-listed sporting goods companies compared to the MSCI Index over the past 12 years (2010 to 2022).
-
 Infographics & Data
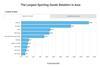
The largest sporting goods retailers in Asia
Our exclusive annual analysis of the largest sporting goods retailers in Asia. Charts and data are downloadable. Exclusive for Premium Members.
-
 Infographics & Data
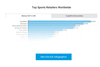
The Largest Sports Retailers Worldwide
Our exclusive annual analysis on the top 50 sports retailers worldwide. The charts and data can be downloaded. This is exclusive data and analysis for Premium Members.
-
 Infographics & Data
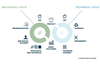
The circular economy explained in pictures
The circular economy is counter to the current linear “take-make-waste” economy; exploiting resources for manufacture, finite product life, and one which ends with disposal. The circular economy differentiates between two types of circular loops: Biological and technical. Products should be designed and produced in a way that all its raw materials can be reintegrated into either one of the loops at the end of its life.
-
 Article
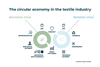
Circular economy in the textile industry in pictures
The principles of the circular economy in textile production are counter to the current linear “take-make-waste” process in the textile industry; exploiting resources for manufacture, finite product life, and one which ends with disposal. The circular economy differentiates between two types of circular loops: Biological and technical. In the textile ...
-
 Infographics & Data
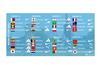
FIFA World Cup 2022’s kit sponsors
These exclusive chart links the sportwear sponsors with their kits by national team for this year’s World Cup, in Qatar.
-
 Infographics & Data
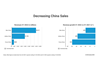
H1 sales growth in China for Nike, Adidas, Puma
This exclusive analysis shows the three top sportswear companies’ first-half revenue and year-on-year revenue growth in China for 2022.
-
 Infographics & Data
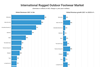
The international outdoor footwear market 2021
This exclusive, yearly analysis includes the market size as well as revenues, market shares and growth for the leading outdoor footwear brands for 2021 and 2020.

